

Viewing Mental Health Parity from a Population Health Perspective
Treating diseases of the brain is as important as treating any physical condition. Yet, U.S. health insurers have earned the dubious reputation of not covering behavioral health conditions (“BH,” aka mental health and substance use disorders) adequately when compared to physical health conditions (“PH,” aka medical/surgical care). From a population health perspective, disease states such as depression, anxiety, addiction and other mental health conditions often have been undertreated, subsequently leading to poor clinical outcomes.
THE COVERAGE PROBLEM
Several factors help explain why BH conditions have not been covered by insurers historically at the same level as PH care. One is that BH treatment was often excluded from or limited within medical insurance policies as a way to contain cost. In some instances, BH care was treated as a carve-out benefit like dental or eye insurance, which created different rules of coverage. Limitations were also put in place because BH treatment: 1) can be complex and involve chronic conditions; 2) often lacks evidence-based interventions; and 3) was sometimes delivered by ancillary medical professionals (e.g., non-MDs).
As part of the effort to promote health equity, federal and state regulators have adopted “due process” protections for patients who have been denied care because an insurer will not authorize “medically necessary” coverage or otherwise make adverse benefit determinations. When someone needs treatment for BH, the last thing they or their family should have to worry about is a questionable insurance coverage denial.
To level the playing field and achieve equity for individuals suffering from BH conditions, a wide variety of regulatory solutions have been adopted both at the federal and state levels, including the Paul Wellstone and Pete Domenici Mental Health Parity and Addiction Equity Act of 2008 (The Federal Parity Law). These legal protections are focused on ending discriminatory health insurance practices against those with BH conditions. To that end, hundreds of regulatory actions have been implemented and court rulings have been made to hold insurers accountable. Unfortunately, these “legal” approaches have only moved the ball slightly forward in helping fix the underlying BH insurance coverage issues.
A POPULATION HEALTH SOLUTION?
Interestingly, from a public policy perspective, a regulatory or judicial stick does not appear to be an optimal pathway to improve population health in terms of promoting more BH coverage or optimizing the limited healthcare dollars to treat the wide array of BH and PH conditions. A population health-based approach might be a more effective carrot to level the playing field by better understanding the relationship between PH and BH conditions and, as a result, creating more effective population health intervention strategies.
To that end, a new theory has been developed referred to as the Behavioral Health Equivalency Index (BHEI or Index), which in early studies appears to show that the actual costs of physical care (and total healthcare) may be lessened if more BH care is provided. Simply put, by spending more up front on BH conditions, the overall cost of population health will be reduced. but with some important variation by subgroups as explained below.
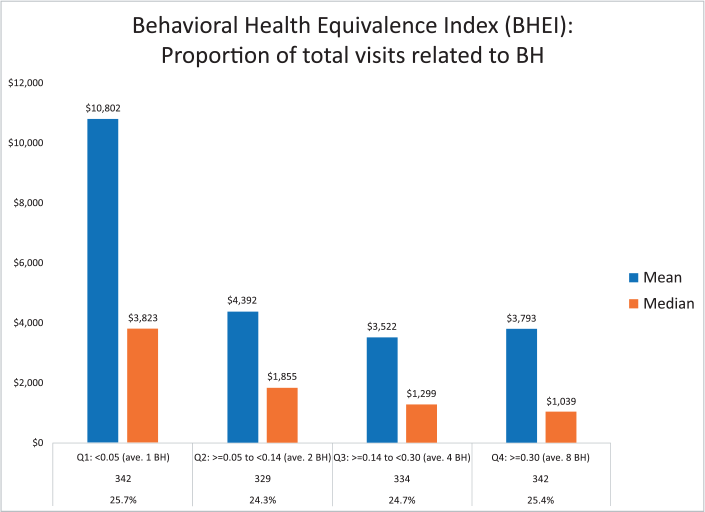
Figure 1. SOURCE: TRAJECTORY HEALTHCARE®
UNDERSTANDING THE INDEX
The BHEI creates feedback loops that can be used by case managers and others to demonstrate the link between specific BH-based program interventions and overall outcomes. The Index is powered through the patented Trajectory® Healthcare data analysis methodology, which creates a customized study design to assess the impact of program interventions more accurately than other evaluation approaches or tools. Multiple sources power this analysis, including medical and prescription claims, lab results and patient surveys. The Index could be used more effectively than the current regulatory enforcement tools to effectuate better insurance coverage for BH conditions and promote mental health parity.
Here is an overview of what the Index highlights in a preliminary analysis — simply put, there is a correlation between the spend rate for BH services in a targeted population and the overall cost of medical care for that population. Although there is variation across subgroups, medical costs are, on average, higher when there are fewer claims associated with BH services for many insured groups. Therefore, better financial and clinical outcomes may be achieved if funders invest more in targeted BH care earlier.
In the sample group highlighted in Figure 1, the population was identified based on each participant having at least one physical health (PH) diagnosis AND at least one behavioral health (BH) diagnosis. The data used from this proof-of-concept analysis was derived from a randomized selection of patients that Trajectory Healthcare has in its database. Participants with no BH claims were excluded from the analysis since they are not part of the targeted population.
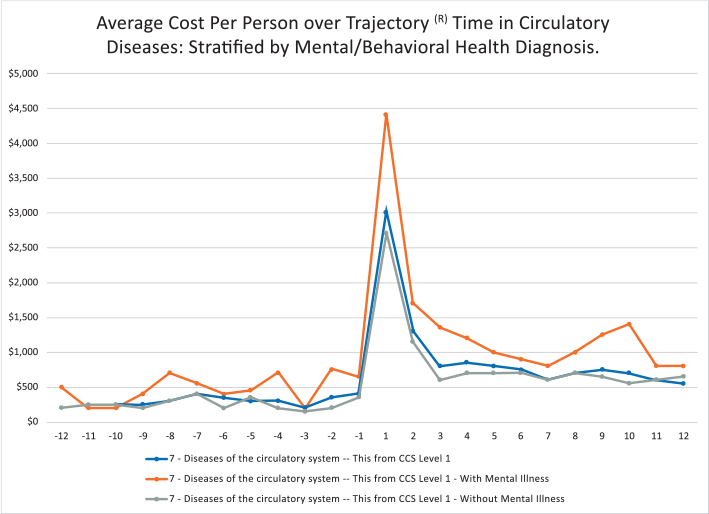
Figure 2. SOURCE: TRAJECTORY HEALTHCARE®
The Index itself is calculated based on the number of BH claims divided by the number of BH and PH claims added together. The BHEI then divides the population into four subgroups by averaging the total number of claims by quartile.
Figure 1 shows the lowest quartile (the two far left bars) — those that have the fewest BH claims relative to the PH/BH claims — have almost double the medical cost of those in the other three quartiles. Specifically, the average (or mean, blue bar) is $10,802 per person and the mid-point (or median, red bar) is $3,823 per person with the fewest BH claims relative to total claims. However, in the other three quartiles, those numbers are much lower. For example, in the third quartile with 4 to 8 BH claims per person, the average (or mean, blue bar) is $3,533 per person and the mid-point (or median, red bar) is $1,220 per person. This suggests an intervention aimed at those with a lower number of BH claims relative to PH/BH claims may provide a positive return on investment.
On a related note, it is important to highlight the compounding population costs associated with both a PH and BH diagnosis. Specifically, Figure 2 highlights — based on the aforementioned Trajectory engine — the various costs of a group health plan by comparing different but overlapping subgroups in that population. The graph highlights approximately the 12 months before and the 12 months after a cardiovascular diagnosis. An overlay of one or more BH conditions shows how the costs are higher in the same general population. Specifically:
- Lowest cost subgroup: The Green line shows the cost by time segment of all individuals with cardiovascular disease without a BH diagnosis (a marginal difference with the next group).
- Middle cost subgroup: The Blue line shows the cost by time segment with all individuals with cardiovascular diseases.
- Highest cost subgroup: The Orange line shows the cost by time segment of all individuals with both a cardiovascular and BH diagnosis (a noticeable increase in cost when compared to the other two groups).
For years, observers have noted that BH patients often have higher costs, but the reason for this was not empirically clear. The BHEI model provides some important insights explaining these medical expense patterns.
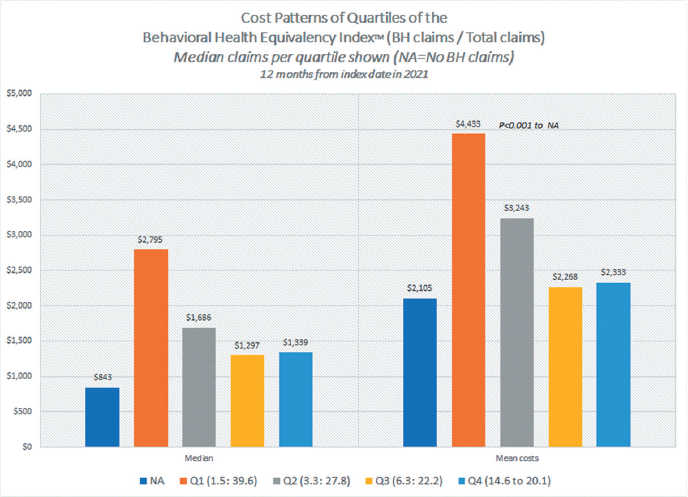
Figure 3. SOURCE: TRAJECTORY HEALTHCARE®
SELF-FUNDED POPULATION APPLICATION
This theory was put to the test by using the claims data from a self-funded employer in the energy field. The data was structured from an index event in 2021 — the index date was defined as the first diagnosis during that time period; it could be either a BH or PH condition.
The claims were assembled from that date forward for 12 months. The total number of PH claims were counted, as were the total number of claims with a BH diagnosis. Similar to above, the BH claims were divided by both the BH and PH claims added together for this population of employees and their covered dependents to create the Index. As a result of that analysis, the BHEI was divided into quartiles as follows:
- Quartile 1: 1 to 6.7%
- Quartile 2: >6.7% to 18%
- Quartile 3: >18% to 43%
- Quartile 4: >43%
- NA: No BH claims
The total cost of care was calculated (using amount paid), and the results were presented as a per-person average (or mean) and per-person median. It is important to note that the median calculation is helpful because the output is less swayed by high-cost outliers.
The overall results are shown in Figure 3 and are formatted differently than Figure 1.
Similar to the proof-of-concept analysis above, Figure 3 clearly shows quartile 1 (the lowest level of BH claims compared to total claims) has much higher mean and median costs than all other subgroups for this self-funded plan (including those without BH health — NA — and those with more optional treatment for mental health in quartiles 2, 3 and 4).
The authors are working now on a peer-reviewed research study that examines these issues in more detail and will help reveal the types of MH diagnoses that are driving the cost trends.
In summary, it does appear that patients with both a mental health and a physical health condition have higher costs than those with just a physical condition. In addition, the overwhelming driver of costs appears to be those with the highest level of sub-optimal BH treatment (as highlighted in the Q1’s in Figures 1 and 3 above). This speaks to the need for a deeper understanding of the reason for this association: Is this an access issue, a patient compliance issue, a provider awareness issue, due to the escalation of complex conditions associated with one’s health status, or based on other factors? All will be explored in the peer-reviewed paper.
TAKEAWAYS
The first major takeaway is that policymakers might want to re-prioritize their strategies to promote better coverage for BH conditions. A punitive approach through regulatory fines and court judgments is missing the boat and not the most effective avenue to properly motivate payers and other plan sponsors. In fact, health plans have devoted substantial time and resources to avoid these regulatory parity testing and enforcement requirements (many of which are somewhat convoluted). A compounding problem is these compliance activities are taking premium dollars away from direct patient care to fund significant administrative function to meet the parity requirements.
As highlighted above, a more direct pathway to level the playing field and better cover BH conditions is to actually pay for more BH care upfront, in part because overall medical costs can be lowered. Ironically, a rising tide can lift all boats. Both the patients and payers benefit from this more integrated approach.
Of course, this is not new news to the case management community. Among other factors, case managers have known for years that patient engagement is an important element of any care treatment plan. If a patient has a major BH condition that is not being treated, the patient is unlikely to be fully engaged and will not be able to effectively follow up on their PH conditions.
Much like a predictive modeling application, which can showcase opportunities for a specific population, the BHEI can add some additional fidelity as to how to best configure and create treatment plans and optimize the outcomes (both financially and clinically).
The value proposition supported by the Index also should challenge policymakers to take a second look at advanced population health strategies encompassing more robust BH coverage rather than trying to regulate their way into a more level playing field. Funders also should take time to update their population health programs in a similar fashion. At the end of the day, the BHEI showcases a better strategy for all concerned.

, JD, MA, is a healthcare attorney and accreditation expert.

, MS, is an independent consultant who works on business intelligence platforms.

, PhD, is an epidemiologist who focuses on population health.
Image credit: LIGHTSPRING/SHUTTERSTOCK.COM